

The Yelp Dataset Challenge
Every year, Yelp holds a dataset challenge in which they release a treasure trove of data to the public. This year’s dataset includes more than 2.2 million reviews, 591 thousand tips, and 71 thousand businesses, and 200 thousand pictures.
The Problem
My question was: How do Yelp users visit the different neighborhoods of their city? Do they tend to visit one neighborhood? Or do they to visit all neighborhoods equally? And within the set of all Yelp users, is there a subset “social butterflies” who go about pollinating their cities more than their peers?
Diversity Index:
To quantify the diversity of users’ visiting habits, I used Shannon’s E, a well-used ecological diversity index.
Results:
The results were unlike anything I had expected. Instead of the isolated clusters I had imagined, the scatterplot showed a single contiguous mass that lengthened and focused as review count increased. In mathematical terms: diversity approaches a limit as review count increases.
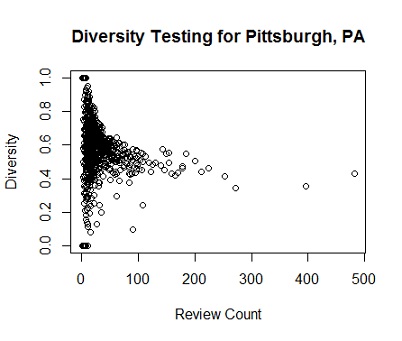
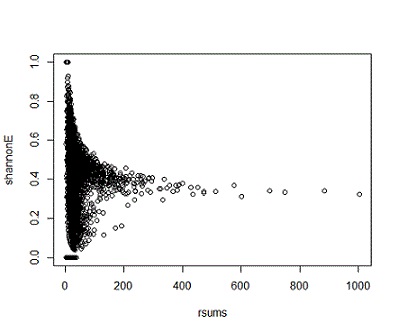
What I inferred from this pattern was that when a user’s review count is low, their diversity index is practically random; the simple reason for this is that according to statistical theory, small samples are likely to be more random than large ones. On the other hand, when review count is high, we get a more accurate representation of users’ true diversity habits; in other words, we’re seeing the law of large numbers in action. Here’s an example of similar behavior in Las Vegas:
What was more perplexing was how homogenous the uses’ diversity scores were.
Going Deeper
What I eventually began to notice was that each city had a different diversity “fingerprint.” True, every city’s diversity-review-count scatterplot was a single contiguous mass, but each city’s contiguous mass approached a different limit. Further research might account for this difference. Perhaps it is has to do with the total number of neighborhoods in a city, or perhaps it has more to do with the geographical density of a city’s hot spots.
The Leftovers
I used R to solve this problem because it provides an good balance between quick prototyping and a robust open-source library.
dplyr is package that is essential for this kind of analysis. The Yelp dataset contains more than two million rows, and dplyr was instrumental in reducing data frame computation times.
Sources:
https://en.wikipedia.org/wiki/Diversity_index
http://www.tiem.utk.edu/~gross/bioed/bealsmodules/shannonDI.html
https://www.yelp.com/dataset_challenge